Debugging & profiling
When a frame paints the wrong thing — a stale region, an unexpected full repaint,
a layer that should be cached but isn’t — renderer.debug is the single source of
truth. It is a core-owned probe that emits a rich per-frame record (which layers
drew, why the frame was full, the exact damage rects, the cache state) and keeps a
rolling history ring you can copy into a bug report.
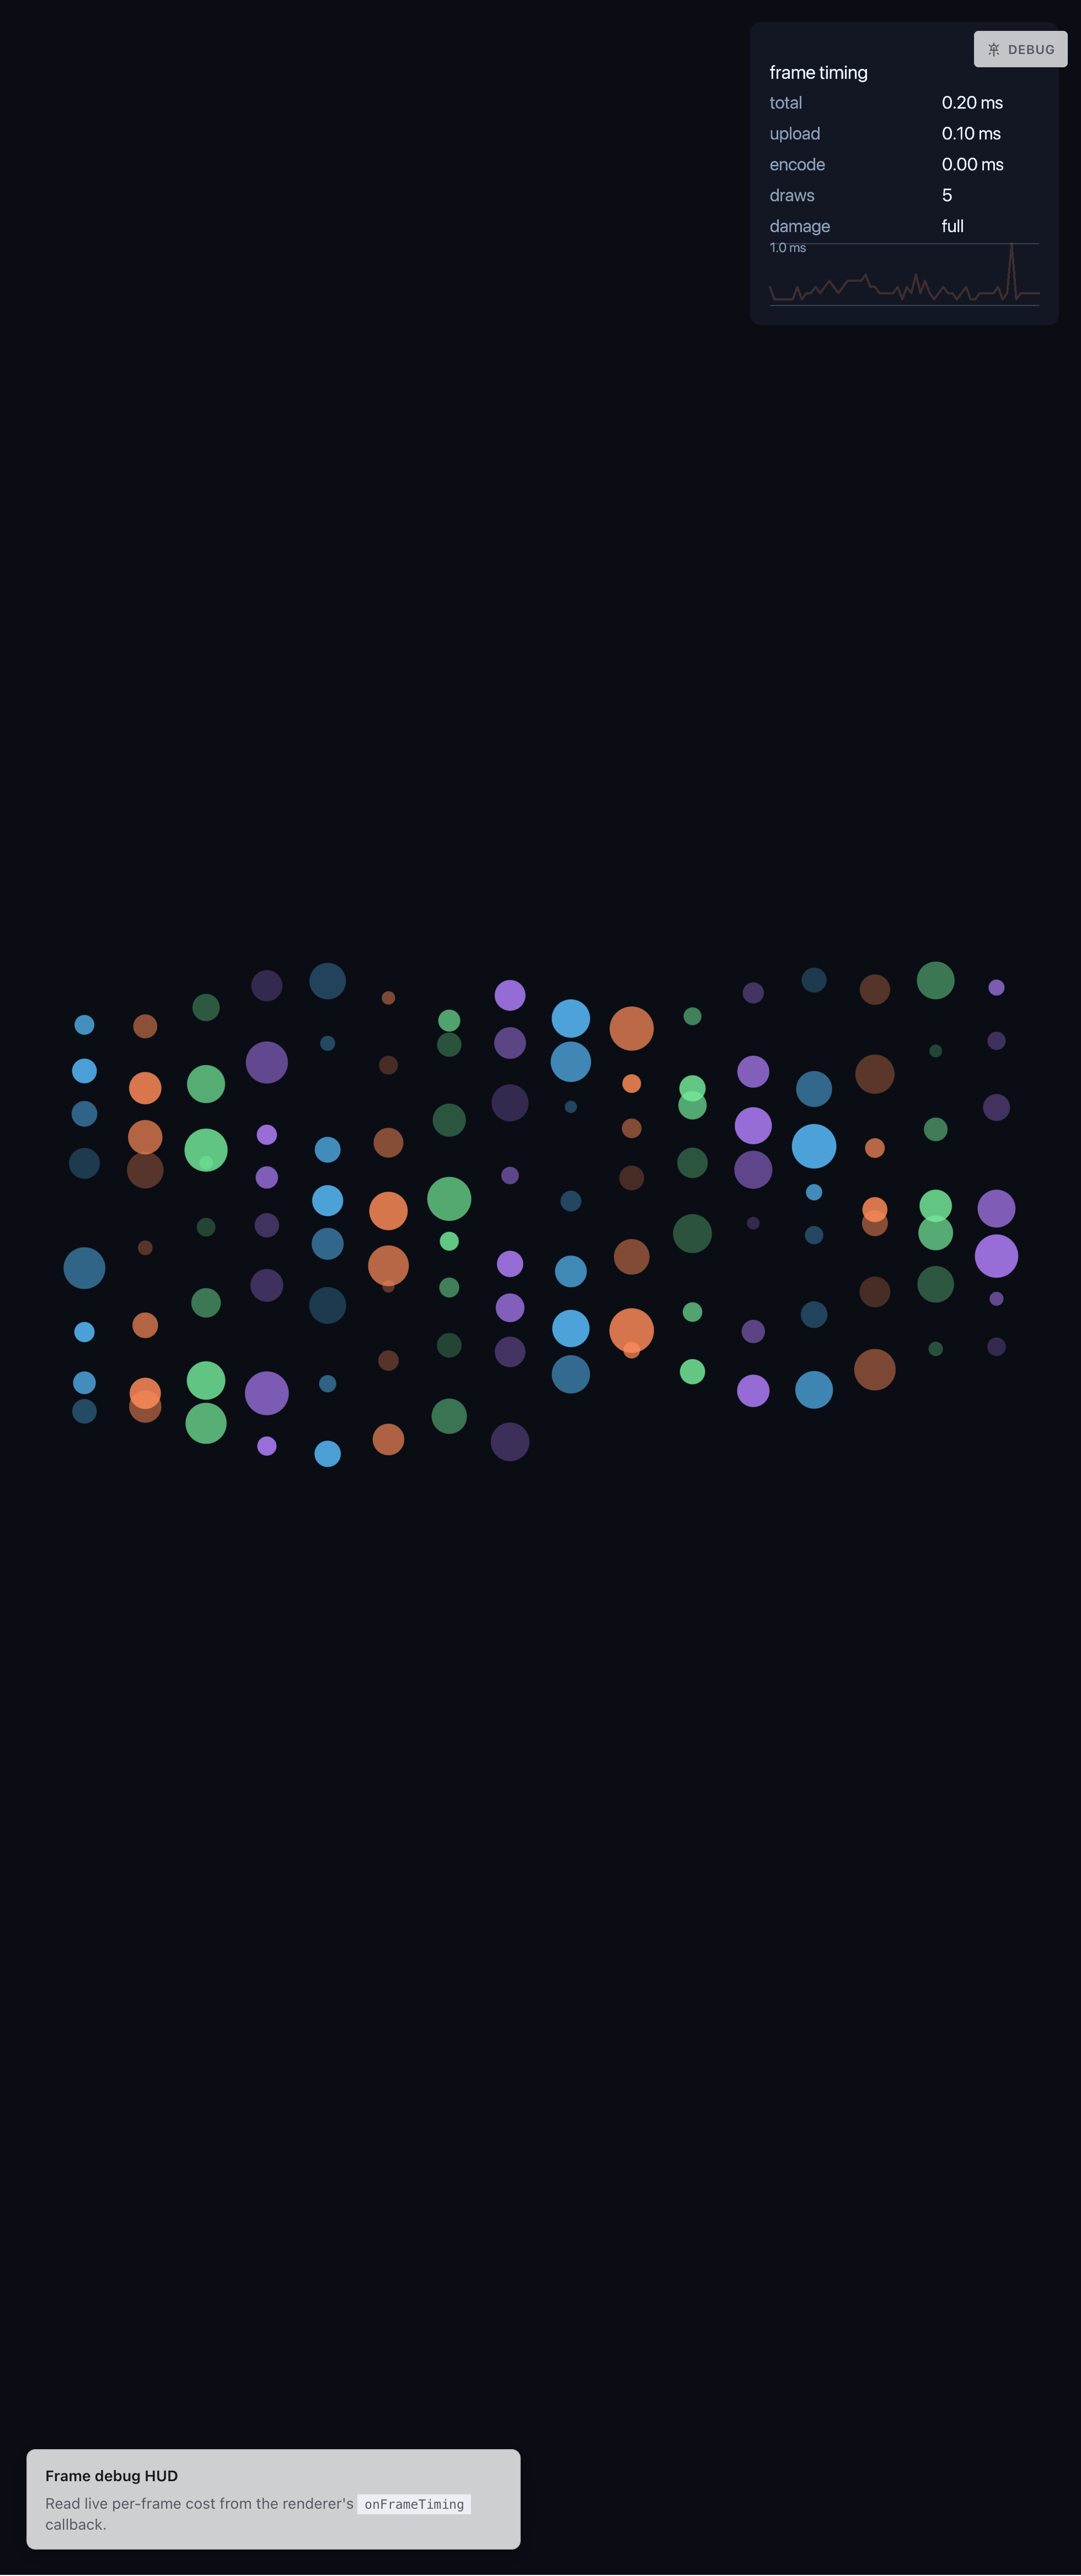
onFrameTiming callback. It is zero-cost when off: constructing the probe does nothing observable, and
the renderer assembles no record unless the probe is capturing. Touching
renderer.debug on a hot renderer is safe.
The render-debug probe
Section titled “The render-debug probe”const probe = renderer.debug; // lazily constructed; does NOT start capturing
const unsubscribe = probe.onFrame((d) => { console.log(d.frame, d.kind, d.fullCause?.reason, d.drawCalls); for (const layer of d.layers) { console.log(layer.label, layer.cacheState, layer.instances, layer.glyphs); }});
// or capture without a listener (e.g. just to fill the history ring):probe.enable();// ...later...probe.disable();unsubscribe();renderer.debug is a RendererDebug:
| Member | Description |
| -------------------------- | --------------------------------------------------------------------------------------------------------------------- |
| onFrame(cb) | Subscribe to the per-frame FrameDebug event. Returns an unsubscribe fn. Attaching a listener turns capture on. |
| enable() / disable() | Toggle explicit capture. Capture stays on while any listener is attached. |
| isCapturing | Whether the renderer will assemble a record this frame (enabled OR ≥1 listener). |
| ring | The FrameRing of frame summaries. |
| lastLayers | The exact Layer[] from the most recent captured render(), or null — mutate visibility / cache-hint by identity. |
| requestRender() | Re-render the retained last layers as a full frame. |
| layerAabb(layer, space?) | Project the union of a layer’s instance AABBs into a DebugRect in space (default "ui"), or null. |
FrameDebugListener is (d: FrameDebug) => void.
The per-frame record (FrameDebug)
Section titled “The per-frame record (FrameDebug)”The live event carries direct Layer references and a per-frame SpaceMap. Key
fields:
| Field | Description |
| ----------------------------------------------------------------- | ---------------------------------------------------------------------------------------------------------------------------------- |
| frame / kind | Monotonic frame index; "full" (clear whole canvas) or "partial" (scissored). |
| fullCause | { reason, changed? } — why a full frame fired. On a "view-changed" full, changed lists the fingerprint parts that moved. |
| regionsCaller / regionsFinal | Damage rects as the caller passed them, and post-pad/clamp (what the GPU scissored). Space-tagged "ui". |
| autoDamage | Per-layer provenance for damage: "auto" frames (which layer produced which rects). |
| spaces | The frame’s SpaceMap. |
| layers | One LayerDebugInfo per Layer, in z-sorted draw order. |
| cache | Bake budget / used bytes / per-bake state / evictions / demotions this frame. |
| emphasis | Decoded setEmphasis mirror ({ focusedKey, dimAlpha, t }). |
| totalMs / uploadMs / encodeMs / drawCalls / damageRects | Frame timing reused from FrameTiming. |
Each LayerDebugInfo carries layer (direct ref), label, zIndex, space,
visible, instances, glyphs, cost, cacheState
("live" | "baked-below" | "baked-above" | "bake-demoted" | "hidden"), and the
layer’s debugData.
A FingerprintPart (in fullCause.changed and config types) is one of
"camera" | "size" | "dpr" | "background" | "view-key" | "z-order" | "visibility" | "buffer-layer" | "emphasis" — so you can see exactly which view
input forced a full repaint.
The history ring (FrameRing)
Section titled “The history ring (FrameRing)”The probe keeps a fixed-capacity ring of lean per-frame summaries (no Layer
refs, no matrices) so history survives without retaining a scene graph, and a bug
report can paste a timeline.
import { FRAME_RING_CAPACITY } from "insomni/internal"; // 240
const timeline = renderer.debug.ring.toArray(); // oldest → newestconst json = renderer.debug.ring.exportJson(); // paste into a bug reportconst { full, partial } = renderer.debug.ring.ratio();
| Export | Description |
| --------------------- | ------------------------------------------------------------------------------------------------------- |
| FrameRing | push, toArray() (oldest→newest), ratio(), exportJson(), clear(), size, capacity. |
| FRAME_RING_CAPACITY | 240 — default ring capacity. |
| summarize(d) | Derive a scalar FrameSummary from a rich FrameDebug. |
| FrameSummary | Per-frame scalars: frame, kind, reason, changed, rectCount, rectArea, timing, and layers. |
| LayerSummary | Per-layer scalar row: label, cacheState, instances, glyphs. |
The coordinate-space model
Section titled “The coordinate-space model”Debug rects cross between four spaces. SpaceMap is the per-frame snapshot needed
to convert between them, and convertRect is the one pure converter — ui is the
hub all conversions route through.
| DebugSpace | Meaning |
| -------------- | ----------------------------------------------------------- |
| "world" | Camera-transformed authoring coordinates. |
| "ui" | device ÷ dpr (“CSS px”). Core’s damage regions live here. |
| "device" | Raw backing-store px (canvas.width); ui × dpr. |
| "css-layout" | The canvas CSS layout box (clientWidth/clientHeight). |
import { captureSpaceMap, convertRect, type RectXYWH } from "insomni/internal";
const map = captureSpaceMap({  camera, // ResolvedCameraState  deviceSize: { w: canvas.width, h: canvas.height },  dpr,  cssBox: { w: canvas.clientWidth, h: canvas.clientHeight }, // optional});
const uiRect: RectXYWH = { x: 10, y: 10, width: 40, height: 20 };const worldRect = convertRect(uiRect, "ui", "world", map);
| Export | Description |
| ------------------------------------------------------- | --------------------------------------------------------------------------------------------------------------------------- |
| captureSpaceMap({ camera, deviceSize, dpr, cssBox? }) | Build a SpaceMap (pure, no DOM). worldToUi is the exact world→ui map the draw/scissor path uses, including under HiDPI. |
| convertRect(rect, from, to, map) | Convert a RectXYWH between spaces via the ui hub. World↔ui transforms all four corners (correct under rotation). |
| DebugSpace | The four-space union above. |
| SpaceMap | { dpr, deviceSize, uiSize, cssBox, worldToUi }. |
| DebugSize | { w, h }. |
| RectXYWH | { x, y, width, height } (no space tag — caller passes from/to). |
Config types
Section titled “Config types”These config-surface types describe the debug record’s space-tagged rects and
fingerprint parts: FrameDebug, LayerDebugInfo, DebugRect
({ space, x, y, width, height }), and FingerprintPart. They are exported from
the package barrel for presenters that type the event.
Span profiling and the presenter UI
Section titled “Span profiling and the presenter UI”The render-debug probe answers what the renderer did this frame. For CPU/GPU timing of named spans across your own code, use the profiler; for a ready-made UI that presents the probe, use the monitor.
- insomni-profiler —
profile(name, fn)/startSpan(name).end()record named CPU/GPU spans into pluggable sinks (DevTools marks/measures). Disabled by default; enable viasetEnabled(true)or the?profile=1URL flag. The disabled path is a fast inline branch. - insomni-monitor — a lightweight telemetry/control panel
that subscribes to
renderer.debugand presents frames, regions, layer state, and the cache budget without you wiring a panel by hand.
See also
Section titled “See also”- Renderer & frame loop —
setEmphasis,forceFullFrame, the view fingerprint. - Damage & partial redraw — full vs partial frames,
damage: "auto", bakes. - Spaces & cameras — the live
world/ui/deviceprojections.